Market Analysis: Chemicals and Plastics
With an extensive background in purchasing excellence and market analysis for chemicals and plastics (see bio below), I am convinced that any purchasing personnel dealing with a strategic product must perform a strategic sourcing market analysis.
To demonstrate past and future demand and growth rates, I have aggregated chemicals and plastics (C&P) data from U.S. market analyses in the tables below. Also tabulated are growth rate comparisons from logistic carriers, which I believe you will find surprising.
Market Analysis 101
Strategic product market analysis requires data in six key areas: 1) Supply & Demand (global or regional), 2) Supplier Capacity by region, 3) End-use Application by region (with growth rates), 4) Detailed Manufacturing Cost and Capital, 5) Historical Price by region, and 6) Imports, Exports, and Trade by region.
Since most prices are driven by supply-demand balance, having this information helps us understand the impact on the price we are paying. Understanding supplier capacity allows us to choose those suppliers who can attend to both our current and future needs. Understanding the end-use applications and their respective growth rates allows us to visualize which industry may compete for volume of our product during cyclic troughs. If we are able to collect manufacturing cost and capital figures, we can understand how much margin our supplier is enjoying and how much pressure we can exert to decrease the price.
My global market analysis here covers 129 product families classified as C&P, in the form of gas, liquid, and solid. Below is a collection of data compiled specifically for the USA, showing the historic and future demand and their growth rates.
USA Data
In 2014 alone, the U.S. market consumed 1,150 billion pounds (521 MM MT) of C&P. Of this amount, 41% was in gas form, 42% liquid, and 18% solid. The main products in volume are:
Gas: Industrial Gases, Propane/Ethane, Ethylene, Propylene
Liquid: Ethanol, Sulfuric Acid, Ammonia, Caustic Soda
Solid: Polyethylene (s), Sulfur, Alumina, Urea
According to the U.S. Department of Commerce, the 2013 gross output was US$784B for chemicals and US$210B for plastics, an 80/20 split. Of the 129 product families in my analysis, the data show 90% volume for chemicals and 10% for plastics, which drives me to conclude that plastics have a unit value two-three times higher than chemicals on the average.
Oil or Gas?
Most C&P products are derivatives of oil and natural gas, either directly or indirectly through energy use. In terms of pricing, most of these follow oil pricing, even if the product can be produced using natural gas. With the 2014 decrease of oil prices (from around US$100/BBL to US$50/BBL), everyone is asking about the impact on the chemical industry.
Because overall prices follow oil pricing, the previous year’s decreasing derivative prices may have incentivized the demand. Europe and Asia, both heavy users of oil, have become more competitive compared to the U.S. because it uses more natural gas (cheaper) than oil, which in turn may trigger more trade between regions. Keep in mind, that most processing crackers are flexible and can use oil or natural gas, depending on the price of derivatives (which brings more return as a whole).
Growth
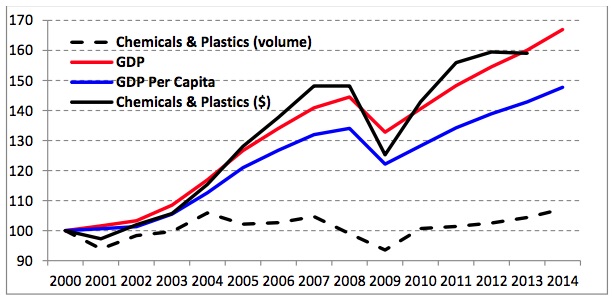
For this analysis, I collected U.S. consumption data from 2000 to the present. The graph below (where 2000 = 100) compares the volume (my data) and gross output (Dept. of Commerce) for C&P to U.S. GDP and U.S. GDP per capita. It is very clear that the gross output (either total or per capita) for C&P is correlated to GDP. The correlation reaches R2=0.99 for a parabolic formula (Y=A+B*X+C*X^2), which may be considered an excellent correlation. This GDP correlation makes sense because C&P are also consumed by sectors like Manufacturing, Construction, Mining, and others, which all end at the consumer. This means that when the country is doing well, C&P is doing much better.
Using different sources of data, my analysis selects the growth rate for each product that makes sense once compared with installed capacity plus announced capacity increases. The table below shows the past and future growth rates for the five-year periods of 2000-05, 2005-10, 2010-15, and future projections up to 2020. I have also added the growth rate from the U.S. Dept. of Transportation for a number of carriers in each mode.

Conclusion
At the moment of publication, any forecast is “wrong” in terms of exact numbers because nobody is able to predict all aspects that affect the final results. The overall growth of 3.1% for C&P is aligned with the U.S. GDP growth forecasts done by the World Bank, IMF, United Nations, OECD, European Commission, and Economist Intelligence Unit.
Additionally, the overall growth is aligned with the decrease of oil prices, which will decrease C&P prices, in turn favoring a higher demand.
All C&P are transported via truck, rail, or marine (including barge). U.S. Dept. of Transportation data show that only truck transportation has shown some increase in the number of carriers. Railroad and marine transportation have either stagnated or decreased. Comparative data is available for neither carrier capacity vs. C&P volume, nor for volume of anything else that is transported. My first impression is that future transportation by rail or marine will be tight.
Taking Purchasing to the next level,
Paulo Moretti
Leave a Reply
Want to join the discussion?Feel free to contribute!