Engaging Purchasing Stakeholders: A Framework that Works

The recent Deloitte Global CPO survey 2018 contained several surprising results. Foremost among them for me was the low level of purchasing engagement between businesses and functions, that is, the purchasing stakeholders.

Purchasing stakeholders, by my definition, are the people in businesses or functions who are affected – either positively or negatively – by purchasing actions and decisions. Therefore, if the stakeholders are affected, it is imperative that you, the purchasing professional should actively engage with them.

The CPO Survey revealed that only “22% of procurement leaders are excellent business partners contributing significant strategic value.”  It was also found that only one-third have “good transparency” at levels below the Tier 1 suppliers.

This same survey further revealed that 76% of procurement leaders use only one approach to understand stakeholder requirements: the procurement team members who are embedded in cross-functional teams. In my view, this reactive approach is harmful to the purchasing function. Instead, we need a more proactive framework to define stakeholder engagement.

In the discussion below, we will identify stakeholders, justify engagement, and provide notes on a framework, approach, and governance.

Who are the stakeholders?

First, we need to identify the primary stakeholder in each commodity.

Organization designs for purchasing may vary, but most of them are divided into Direct and Indirect spend. Raw Materials and Packaging (RM & Pack) are commonly seen as part of Direct spend; Indirect spend typically includes Maintenance, Repair, Operation (MRO), Capital Expenditure (CAPEX), and Corporate Services. Logistics is divided between Direct (with freight costs from Truck, Rail, or Marine in RM & Pack) and Indirect (when freight is related to the sell side).

For RM & Pack, the primary stakeholders are the Business Director or Marketing Director. These are the people accountable for the profitability of the business when RM & Pack are the main input affecting the profitability.

For MRO/CAPEX, the primary stakeholders are Maintenance Leaders, Engineering Leaders, and ultimately the Plant Director. For Corporate Services, the primary stakeholders are the Function Leaders where we have a significant spend in IT, HR, Legal, Marketing, EH&S, Travel, and others. Finally, for Logistics, the stakeholders are Supply Chain Leaders.

A more traditional way to find the stakeholders has been to wait for something to go wrong in purchasing and notice whom to point fingers at. This failed approach underscores the importance of proactivity in stakeholder engagement.

Why stakeholder engagement?

Since stakeholders are affected by your decisions and actions, it is essential to engage with them. As I see it, there are four primary objectives in stakeholder engagement related to the actions and decisions made by purchasing.

  • Assure strategic alignment between Purchasing and stakeholders
  • Engage stakeholders in sourcing and project management
  • Engage stakeholders in selection and supplier management
  • Engage stakeholders in target setting and performance management

Following are five common concerns related to engagement (or the lack thereof).

  • Is purchasing aware of strategic business moves that can affect the supply chain?
  • Is purchasing informed about demand growth so that needed materials can be acquired on time?
  • Are stakeholders informed about supply market insights and price movements?
  • Are stakeholders aware of supplier performance?
  • Are stakeholders informed when their main product is being sourced?

Framework

Our framework is a simple, structured mechanism that is not time consuming for stakeholders. The model below can be used with any commodity with two levels of engagement. The higher level is the Steering Team, composed of the VP of Purchasing, the Purchasing Director, and the Business Unit President (or Function Head). The lower level, the Sourcing Council, is where most of action will take place.

Approach

Purchasing leadership should identify potential Sourcing Councils according to three criteria: significant spend, observed misalignments, and strategic impact on the organization. For accountability purposes, purchasing leadership should name one person to each Sourcing Council who is most knowledgeable about that area’s main products or services.

The selected person will prepare a presentation that includes Objectives of Engagement, Engagement Model, scope with defined purposes, and potential Sourcing Council Dashboard to be used. That person will then set up one meeting with stakeholders to make the proposal to create the Sourcing Council.

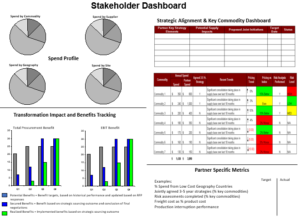
If a stakeholder decides to not engage in this model, the purchasing professional will at least have done his/her part in proposing the engagement, with the knowledge that the Purchasing stakeholders have been properly advised. On the other hand, if the stakeholder decides to engage, then quarterly meetings can be defined and stakeholders can decide what belongs in the Dashboard (see example below).

Governance

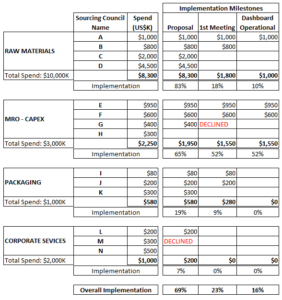
In order to track the progress of the sourcing councils, the Steering Team should create a quarterly mechanism to capture major implementation milestones. These would include when the proposal was done, when the first meeting happened, and when the Dashboard became operational (as shown in the example below for one specific quarter).

By using this tracking system, the Steering Team will know how much spend is possible according to Sourcing Councils, and then by each quarter, the degree of completion for proposals, first meetings, and Dashboard operationality. Once the Sourcing Councils are operational, the Steering Team is only advised when a Sourcing Council has critical matters to report.

Take-away

It is clear from the CPO Survey 2018 that there is a lack of engagement between purchasing and stakeholders. In order to change this picture, we need to be proactive and create a structured mechanism that aligns with stakeholder strategies, provides market insights, and has stakeholders participating in the sourcing activities, so that both sides can enhance the value delivered to the organization.

Taking Purchasing to the next level,

Paulo Moretti

Artificial Intelligence in Procurement: How will it affect you?

On a daily basis, we see artificial intelligence (AI) impacting our lives, and its advancement is not slowing. It’s already at work in iPhone’s SIRI and Amazon’s Alexa. It’s just around the corner in self-driving cars (an area where my engineer son works) and in motorcycles.

AI powers search algorithms for Google, Alibaba, SAP’s Leonardo, and IBM’s Watson platform, which act in Sales (contextual marketing), Plant Management (automated defect detection), Supply Chain Optimization, and R&D (predictive diagnostics), as well as autonomous weapons. In Finance, 70% of all financial transactions today are performed by algorithms, a kind of artificial intelligence.

Major players like KPMG, Accenture, SAP, and IBM are betting that large enterprises will pursue cognitive procurement as the logical next step in their overall digital transformation.

I am not an AI specialist, nor do I have an IT background, but I’ve been collecting elaborate information on potential uses of AI in the Procurement arena. I am confident these can happen as soon as we solve some outstanding issues in our field. What follows is a historical review of AI, an examination of issues in procurement, and finally, a look to the future.

Background and Applications of AI

In the 1940s, the American mathematician Norbert Wiener (1894–1964) invented cybernetics. According to Wiener, the behavior of systems could be controlled by means of suitable feedback, but the necessary technology was not available in his time. That, however, has changed, and the technology is definitely here.

Following are several ideas for using AI technology in a business context:

  • Pattern recognition: Understanding typical trends or behaviors for customer financial transactions and spotting anomalies in an account’s spending data to identify potentially fraudulent behavior.
  • Prediction: Capturing short- and long-term variability in data to improve forecasting of energy consumption or predicting future prices.
  • Classification: Examining animal track images and grouping them by species type to support wildlife conservation efforts.
  • Image recognition: Determining if nodes on a patient’s raw CT scan are malignant or benign, or face recognition in iPhone X.
  • Speech to text: Transcribing customer call center voice messages to text for detection of sentiment and further analysis.
  • Cognitive search: Offering personalized recommendations to online shoppers by matching their interests with other customers who purchased similar items.
  • Natural language interaction (NLI): Telling a software application to generate a report on sales revenue (or procurement spend) predictions without making humans run the reports.
  • Natural language generation (NLG): Getting summaries of everything that has been analyzed from a large document collection.

This fine article about use of AI in business recently appeared in the Harvard Business Review: Robo-Advisers Are Coming to Consulting and Corporate Strategy.

Procurement Concerns with AI

According to the 2017 Deloitte Global CPO Survey, Procurement leaders reported these significant concerns:

  • 49% – Quality of data
  • 42% – Lack of data integration
  • 29% – Skills/capabilities of analytics resources
  • 29% – Current technology
  • 26% – Limited understanding of data technology

So, massive hurdles due to legacy enterprise IT systems and data silos

The first two issues reported by Procurement leaders are the major hurdles to implementing AI in Procurement. I experienced precisely such challenges dealing with quality of data and data integration when I was responsible for implementing Spend Analytics at Dow Chemical Co. (now DowDupont). Based on this experience and exchanges with other large companies, I have learned that the bigger the company, the bigger the data issues Procurement officers will face.

Dow used to run SAP R2 with thousands of modifications, while simultaneously running SAP R3 from its Rohm & Hass acquisition, plus 12 legacy IT systems (mainly MRO). ERP systems (like SAP) force us to code any raw material (SKU) and packaging so the system can calculate the variable cost for income statements. Even with forced coding, we find the same raw material with different codes or different names, including trademarks, even when English was the only language used.

The nightmares begin when you go to MRO (maintenance, repair, and operation), Logistics (freight), and Services. This is where the system does not force a unique code, the language is not necessarily English, and systems are different. Another issue is the lack of discipline in supplier names and codes. There are dozens of different names for the same company, which could include different legal entities or even simple misspellings.

Dow solved the problem years later by replacing everything with a new SAP platform. The key to this change was the leadership from the VP of Purchasing (my boss) who had an IT background and understood the issues we were facing. She helped me define specific resources to create product codes, service codes, and supplier codes (parent-child relationships), so we could have the same, consistent data on a global basis.

Companies like DowDupont and others who have invested in quality data and data integration will be among those prepared for AI integration in Procurement.

Some Predictions

Deloitte’s CPO Survey offered a succinct summary of the high impact outlook of transformations in these segments. It observed, “Source to Contract is becoming predictive, Purchase to Pay is becoming automated, Supplier Management is becoming proactive, and these are all empowered by analytics and strong operational management.”

In an interesting article, Edmund Zagorin proposed the following ways that AI could rapidly transform enterprise Procurement organizations over the next five years:

  • Cognitive systems replacing supply chain assistants
  • Cognitive systems replacing purchase order systems
  • Cognitive systems replacing supplier on-boarding workflows
  • Cognitive systems forecasting prices, generating contract templates, and evaluating suppliers before a human does

I agree with the reasoning of these predictions but would add a cautionary note. The timing is ripe, but only for those companies that have solved issues of quality of data and data integration. A further caution is that these predictions are still at the operational level and are not yet strategic.

Next Digital Transformation

The biggest impact on Procurement remains yet to be elaborated. My vision of AI in this arena is related to strategic sourcing where AI will generate alerts, from thousands of sources, including our cleansed system, about what is happening in the market to help sourcing managers make decisions to benefit their specific business and the company as a whole.

For example, we know that Crude Oil, Coal, and Natural Gas costs affect prices of most of chemicals and plastics. We also know that Crude Oil affects freight costs, metals costs affect MRO, and labor costs affect services. We have seen that natural disasters, plant shutdowns, product recalls, and company bankruptcies have affected the supply chain. Finally, of course, the supply-demand balance affects what we all buy.

Once your company has done the necessary homework to internally fix the quality of data and data integration, AI will be able to map everything you buy, from any company and in any location, and then correlate them with cost drivers, supply chain network, supplier profiles, finance, and natural disaster news. That means AI can generate alerts (called Cognitive Insights)  that can impact supply, demand, and/or prices, allowing you to decide what action you might take to protect your company against supply disruptions or to create savings opportunities.

Companies like ICIS, IHS, and ChemicalInfo (in the chemical space) as well as Beroe Market Intelligence have the Procurement knowledge capital to work in this space. What they will need to do to continue their advancement, however, is to join with AI firms to develop the next digital transformation.

Take-away

Without a doubt, artificial intelligence is coming and is poised to impact the Procurement world. It will immediately impact jobs on the operational side and then begin to affect strategic sourcing by improving awareness about what will impact strategic decision-making. Once the companies can fix the quality of data and data integration within the company, they will be well positioned to make this world-changing leap.

Taking Purchasing to the next level,

Paulo Moretti

RISK MANAGEMENT TOOL

Every year, consultant companies survey purchasing leaders to understand their main objectives for the year, and regularly, risk management is listed as one of the five most important. The American National Standard for Security provides organizational resilience guidelines for security, preparedness, and continuity management (ASIS SPC.1 2009). These help companies define the overall framework for Enterprise Risk Management (ERM), where purchasing is just one piece of the puzzle.

A simple view of risk management is to know what risks should be tracked, and then, to have a mitigation plan to decrease or eliminate the risks. In purchasing, the most important objective is to avoid supply disruption, which may interrupt production, causing a loss of revenue.

The internal clients, businesses, and functions do not want to receive the bad news of supply disruption of a product or service. Compounding this problem, some clients are not willing to spend time to understand which risks they are facing because they are difficult to measure and difficult to translate into numbers. A simple, yet effective, way of communicating risk is to share with a client a graph showing the probability of risks and potential impact on their revenue if no mitigation plan is implemented.

Risk Framework

The graph below is generated by the Purchasing Risk Assessment (PRA) tool. First, it shows the likelihood of supply disruption and the impact on revenue without a mitigation plan (called Initial Risk) and then the supply chain with a mitigation plan implemented (called Final Risk). Of course, it is the client’s decision whether to implement the mitigation plan or not; as consultants, our role is to clearly communicate the risks and subsequent impact on the business. – See more at: http://www.mypurchasingcenter.com/purchasing/industry-articles/purchasing-risk-management-tool/#sthash.OzKy16oC.dpuf

With the PRA tool, we are able to cover the most common risks faced in the purchasing of products and services. The framework is composed of four risk dimensions: Market Structure, Supplier, Supply Strategy, and Supply Chain. Each risk dimension contains three risk drivers with a risk scale from low to high. Below you will see risk drivers for raw materials in each dimension.

Market Structure

  • Company Volume / Approved Supplier Capacity: How dependent you are on existing approved suppliers. If you buy 50 units, and approved suppliers have 100 units, you are at a great risk. If you buy 10 units, the risk is lower.
  • Supply / Demand: How approved suppliers in the industry are operating. Capacity utilization of 90%+ gives higher risk.
  • Technical Options and Time to Approve Alternatives: Do you have other options? How long will take to approve new options? You are at risk if no options exist or it take too much time to approve another option.

Suppliers

  • Number of Qualified Suppliers: If you have just one, this means higher risk to your supply chain.
  • Supplier Financial Health: If any suppliers are struggling from a financial perspective, you may face higher risk.
  • Number of Sourcing Points or Supplier Plant Locations: You face additional risk due to natural disasters or geopolitical instability.

Supply Strategy

  • Volume under Legal Contract: If you lack contracts in place, you have higher risk.
  • Supplier’s View of Company: If your supplier does not see your company as a key customer, you have higher risk.
  • Specification: Are your specifications solely your creation, or are they common across the market? If specifications are not standard, the risk is higher.

Supply Chain

  • Hazard of Material: Are these products hazardous? Do they require special transportation? Special transportation is riskier than regular modes.
  • Supplier Back-Integration: Is the supplier back-integrated in the feedstocks? Having back-integration involves lower risk because it does not depend on others.
  • Leadtime (of Closest Stock): Can you have your product in three or 30 days? Longer leadtimes bring about higher risks.

Purchasing Risk Assessment

The PRA tool can assess risk for different commodities: Raw Materials, External Manufacturing, Packaging, MRO, Services, and Logistics (Marine, Rail, or Truck). For each commodity, we have selected three risk drivers for each risk dimension.

Because each company evaluates risks differently, the tool allows users to weight each risk dimension and each risk driver. For example, one company may have Market Structure at 30%, Supplier at 35%, Supply Strategy at 20%, and Supply Chain at 15%, totaling 100%. The same weighting applies to the risk drivers. Most important is to keep the percentages for each commodity fixed; for example, all raw materials will have the same weighting as shown in the above example.

For each risk driver, we show a scale from 1 (low risk) to 5 (high risk). You are first able to quantify each current risk driver (with no mitigation plan in place). Then, you can enter key words for mitigation planning (like “Qualify two new suppliers”), and assuming the mitigation plan is implemented, you can show the final (revised) risk. For example: You are sole sourced, with an initial risk of 5. Approving two new suppliers moves the final risk to 2. The same is done for all 12 risk drivers (that is, four dimensions with three risk drivers each).

It is important to note that the risk scale from low to high is not intended to be used as a precise quantification of the risk. Rather, its benefits are in creating comparative ranges. Therefore, the most important result is not the score itself, say, 1 or 2. Rather, it shows the direction of the risk, say, from 3 to 2 or from 4 to 1.

Purchasing inputs include many elements: year, quarter, manager’s name, director’s name, product or service name (SKU), total spend (US$MM), and revenue (US$MM). Total spend is how much of the product or service is bought in the year. Revenue is more difficult to input; however, it is the most important. The idea is to understand where the product or service is used by the company and how much revenue is generated in the year. Normally, marketing managers and business directors understand where products or services are used and how much revenue they generate.

For each risk assessment, the PRA tool generates a similar graph as shown in this article, which consultants can show to their businesses. It facilitates our client conversations because we are showing that 1) a risk assessment is being performed, 2) there is an impact on the business, and 3) we are proposing a mitigation plan.

The PRA tool also can record all the information and data input into a database, so we can track which product or service has been assessed. Furthermore, we can use the database to understand spend per commodity where risk assessment has been done and risk assessment spend by buyer or director.

Take-Away

If risk assessment is part of a company’s agenda, Purchasing can do this job. Naturally we will not assess all products and services we buy, but certainly Purchasing understands which ones are most critical or at current risk.  The PRA tool provides a simple risk quantification and facilitates our conversation with internal clients.

If you have questions about such an SAS tool implementation, please contact me by email at paulomoretti@pm2consult.com  for an initial consultation.

Taking Purchasing to the next level,

Paulo Moretti
Price Forecasting: Who Needs That?

Common wisdom says that any price forecast is already wrong the moment it is published. I can only smile and agree with this. If people were able to predict the price of anything, they would be billionaires and very well known by now.

I’d like to hold this thought about price forecasts for a moment and talk about something we all know about: Weather forecasts.

Weather Forecasting

Historians tell us that Babylonians in 650 BC predicted the weather from cloud patterns. Around 300 BC, Indian astronomers developed weather-prediction methods. It was only in 904 AD that Wahshiyya, an Iraqi alchemist, began forecasting weather based on observed patterns of events called pattern recognition. The publication of written weather forecasts did not begin until August 1st, 1861 by Admiral Robert Fitzroy (in The Times of London). That means official weather forecasting turns 152 years old today.

Fitzroy started studying weather forecasting for a good reason. In 1859, a steam clipper named the Royal Charter was lost in a terrible storm with at least 450 killed. For years he published the forecasts despite strong criticism that they could not possibly be accurate. After much debate, his public forecasts ended in 1866.

From the BBC, “You have to admire Fitzroy for trying. He saw the big picture and walked the first few steps along a very hard path. Even now, when we have a sky full of satellites and enormous computational weather models, we don’t always get it right.”

Today, we all use weather forecasts to prepare for future events. From air and marine traffic, to crop reports and outdoor weddings, we all rely on accurate data to guide decisions on our safety, business, and social lives.  And despite our best technology, we still sometimes get it wrong.

Those criticisms of inaccuracy with weather forecasting most certainly apply to our earlier topic of price forecasting. However, for the savvy user, price forecasting can be an invaluable weapon in the Purchasing arsenal.  Let’s see how.

Futures Markets

Many companies already use futures markets in currencies, grains, metals, and energy, trading over US$1.5 trillion a year. Commodity prices are volatile according to the balance of supply and demand. To mitigate this volatility, a futures contract is an agreement to buy and sell an asset at a certain date at a certain price. That is, Investor A may make a contract with Farmer B in which A agrees to buy so many bushels of B’s corn at $15 per bushel. This contract must be honored whether the price of corn goes to $1 or $100 per bushel.

Futures contracts can add stability to certain markets, but they contain the risks inherent to all speculative investing. Here, then, is a prime use of price forecasting.

Price Forecasting

Purchasing deals with prices every day for diverse categories like Raw Materials, Logistics, MRO, Capital, Packaging, Labor, and other products and services. Some categories already have price forecasts done by well-respected companies like ICIS (forpetrochemicals, energy, and fertilizer), IHS Global Insight  (forcountry and industry forecasts), and many others in specific fields.

Many collect opinions from hundreds of experts to understand the trends and cost drivers to publish their forecasted prices. Others have developed mathematical models to predict future prices. To be sure, both methods incur inaccurate predictions. However if trends are identified, Purchasing can take a reasoned position about buying more or less, according to their perceived needs.

Models

Experts in price forecasting identify two kinds of models: Univariate and Multivariate.

  • Univariate modeling is based solely on the history of the variable being forecast itself, using trends, seasonality, and cycles. It is used for short-term forecasts.
  • Multivariate modeling is based on the history of variables and drivers like GDP, PPI, inflation, raw materials, etc. It is used for longer time horizons. Best practices say that each year of forecast requires four years of historical data.

Development Process

The eight steps below are based on my own experience at Fortune 500 companies where we developed models for Raw Materials, Logistics, and MRO, totaling US$12 billion of spend.

Define with category leader the product families to be forecasted based on their priorities and business needs. The definition must include the region and the lowest level of granularity as possible.

Using Mind Map, interview the purchasing expert to capture and visually outline the information about cost drivers. You must understand what affects the price of your product or service in each region.

Collect the external historic macro-economic data of all the cost drivers you are able to find. To maximize certainty, collect four years of data.

Collect the historic internal data of the product or service you want to forecast. Again, it is best to collect four years of data.

Using specific software from SAS (Statistical Analysis System), compare both internal and external historic data. The software is able to show which 3-5 external variables are most correlated with internal data by calculating the R-square for each variable (where higher is better).

Develop the forecast models where each variable participates in such proportion and time lag effect. For example, if the model is driven by GDP, PPI, and Raw Material X, the model may have a proportion of 3X, 2 PPI, and 1 GDP effect; it also includes the time lag like GDP 3 months in the future, with one month ahead for PPI and Raw Material X.

For each model, the software calculates the Mean Absolute Percent Error (MAPE), where below five is considered excellent.

Once all models are developed, one person from the category is able to update the recent historical data monthly or quarterly, run the model with the help of an Excel add-in, and publish the graph forecast to users and business clients. Each update adds one time horizon, keeping a 12- or 18-month horizon.

Price_Forecast.JPG

The above graph shows the historic internal data (dots) very close to the model (line), which reconstructed the past using past driver data. This means that the price forecast has 95% confidence.

Takeaways 

As with weather forecasting, people in Purchasing use price forecasting to prepare themselves for future events. Although never 100% accurate, they show us trends and patterns that can be used to avoid big losses.

Purchasing people have used price forecasting in order to:

  • Inform business clients about trends so they can take proactive price actions to prevent margin erosion.
  • Inform other internal clients for budgeting capital expenditures and freight costs.
  • Adjust product and service sourcing plans for buying more or less according to the needs and price trends.
  • Use repeatable data-driven methodology to understand price trends.

Although there is still criticism of price forecasting, just as with weather forecasting, it is only a matter of time before we adapt to it and learn how to use it well. With experience, I trust this process will not take us another 152 years to achieve.

Taking Purchasing to the next level,

Paulo Moretti
How to Inform Price Changes to Business

Do raw materials have a major impact on your company costs?  If so, any of your business colleagues worth their salt will want to know ASAP when their raw materials undergo a price increase.

Of course, for raw materials with big spend dollars and high variable-cost impact, purchasing usually informs its internal clients about changes in price.

Now, imagine that you are able to show, on a monthly basis, the overall price increase or decrease of all raw materials!  Moreover, that you are able to show the price impact over the following three months in the future, serving as a purchasing alert for what is happening in the marketplace, allowing business colleagues to take proactive measures and prevent margin erosion.

Price.png

This is possible without additional software, just using your company data along with Purchasing Alerta™, an Excel spreadsheet developed specifically for this purpose. 

Before I explain the Purchasing AlertaTM tool, let me go over with you some crucial terminology: timing, prices, business structure, and three economic terms.

TIMING

In any supply chain we have inventories of Raw Materials (RM), Work in Process, semi Finish Goods and Finished Goods (FG).  Those inventories serve as buffers to meet uncertainties in demand, supply, and movement of goods.  Every industry adapts these for the timing needed to avoid specific uncertainties.

According to a study from Hackett Group (SupplyChainDigest), the 2010 average days of inventory outstanding for hundreds of public U.S. companies was around 51 days.  To that we must add the manufacturing time, Work in Process and movement of goods.  Even for very efficient companies, these factors move the timing to an average of 90 days.

Based on accounting rules, RM prices register in the books or ERP systems the moment the product arrives at the plant, or more precisely, register the quantity received and total amount to be paid.  Under the same rules, sales are registered the moment the FG leaves the plant to the customer.  With a lag time between RM and FG around 90 days, a RM purchased in January is part of the FG sold in April.

PRICES

Unit price in purchasing is defined as the total amount to be paid divided by the total quantity received.  The Unit of Measure (UOM) used to define the quantity is used in a unit price like $/pound, kilogram, metric ton, square meter, etc.

Purchasing departments deal with variability all the time because the same product is purchased in different UOMs according to the geographic region.  The USA, United Kingdom, and former British colonies use English units of pounds, ounces, tons (long and short), gallons, and cubic feet.  Most other countries use metric units of kilograms, metric ton (1000 kg), and liters.  The same mix of UOM is used on the sell side by the company.

UOM.jpgThe problem of comparing sales unit price with RM unit price is that both must be in the same UOM for accurate comparison.  In order to meet this need, Purchasing AlertaTMwas developed to translate almost all UOMs, from sales and purchasing, into one measurement, allowing users to compare apples with apples.


BUSINESS STRUCTURE

Each organization has its design based on business type and structure.  The most common structure has at the highest level the global business unit (GBU), where it is divided into business groups, business units, value centers, and performance centers.  The names used in the organization may differ, but the structures follow the same rational: aggregation of products.  Each product sold belongs to a performance center, which belongs to a value center, and so on.

Once the corporation defines its structure, finance and business develop the sales structure accordingly, and controllers (as a part of finance) develop cost accounts accordingly.  For example: Product A is manufactured using RM “X” and “Y.”  On the sell side, Product A is registered into the system in the appropriate performance center, value center, and so on.  The RM “X” and “Y” are registered on the cost side following the same business structure.

GBU.jpgFollowing accounting rules in any country, any sale of a product is registered into the system in the correct business.  Likewise, any raw material used to manufacture that product is also registered in the same business. Purchasing AlertaTM was developed to link both sales and purchasing in the same manner, at any level desired. 


ECONOMIC TERMS

Margins are terms used in economics to define the amount of money remaining after deduction of certain items and normally used in the income statement analysis.  The income statement starts with revenue and then shows all possible costs reaching profitability.  Three important margin terms are:

  • Contribution Margin: This is the revenue less the variable costs.  Variable costs are composed of all input costs which vary according to the quantity of products sold (raw materials, packaging, utilities, etc.).
  • Gross Margin: This is the contribution margin less the fixed costs.  Fixed cost is composed of plant labor, maintenance, depreciation, and all other costs in the plant (which do not change with produced volume).
  • Operating Margin: This is the gross margin less expenses.  Expenses are composed of R&D, administration, sales, marketing, etc.

Purchasing AlertaTM shows the difference between sales unit price (SUP) and raw material unit price (RMP).  This is a margin close to the contribution margin because it contains all raw materials but not packaging or utilities; for this reason, we call this the Delta margin.

PUCHASING ALERTATM

Any company where raw materials have a high impact on cost can use this tool.  The software gives an alert to business colleagues on what is happening in the marketplace related to all raw materials purchased by the company compared to their sales unit price (SUP).

More important, it alerts users as to what will happen in the coming three months, so colleagues can take proactive actions to avoid margin erosion.

Purchasing_Alerta.JPG

Scales

  • Both Y-axes are, in this case, in $/pound, the unit of measure (UOM) common to sales unit price (SUP) and raw materials price (RMP).  All UOM, from sales and purchasing, were translated into just one UOM.  The blue line represents SUP, andred line represents RMP.
  • The X-axis presents two time scales, one for SUP (top) and another one for RMP (bottom).  The scale for RMP is staggered three months ahead. As explained in the paragraph above Timing, there are around ninety days of lag time, so a raw material purchased in January will comprise part of the cost of a sold product in April.
  • The delta margin is the difference between SUP and RMP in $/pound represented in the bars.

Forecast

As we have a lag time of ninety days between the raw materials and sold products, we can forecast the cost impact in future sales.  In reality, we are using actual RM data from the ERP system which will be part of the cost of products to be sold in the future.

As purchasing professionals are not expert in predicting sales prices for the future, we assume the sales price (SUP) from the ERP system will remain flat in the next three months based on last price available.  This is, at least, the conservative view.

With this SUP “forecast” we are able to calculate the delta margin (gray bars), showing the improvement or erosion of margin in the next three months, and our business colleagues can take proactive measures accordingly.

Business Structure

business_structure.pngThrough a drop-down tool, you can select any business level, according to the existing business structure, and the graph will display the data accordingly.


Relevant Information

relevant_information.pngThis tool also calculates other relevant information: Impact on sales (total purchasing costs divided by the total sales, for each selected business) and Percentage of products translated to the same unit from all UOM in the ERP system.


HOW THIS FITS YOUR COMPANY

The Purchasing AlertaTM tool can be adapted to your company and you will be able, on monthly basis, to alert your business colleagues about what is happening in the marketplace.

  • You define the business structure you want to show
  • We prepare the tool with all your sales and purchasing data
  • We coach you on defining the process of monthly data collection
  • We coach you how to do the monthly updates, while you manage the tool internally
  • You need no software, just a person to collect the data, manipulate it in the tool, and publish in your Intranet for access by your business colleagues

To request a free demonstration, email paulomoretti@pm2consult.com.

To download a PDF of this white paper, please click here–How to Inform Price Changes to Business

Spend Management: A Necessary Evil?

Several articles and white papers have been written about spend management and spend analytics. Let’s use Wikipedia to define each one:

  • Spend analysis is the process of collecting, cleansing, classifying and analyzing expenditure data.
  • Spend management is the way in which companies control and optimize the money they spend.

Companies have invested money and resources in spend management with two main objectives: Aggregate spends so you can leverage your purchasing power; and decrease “maverick” spending (buy from non- preferred suppliers).

Around 10 years ago, companies defined spend management as one of their key priorities. Last December, Aberdeen published its survey in the 2012 CPO Submit, which shows that spend management is the second biggest technology investment and the third critical need in their organization. So, I was wondering why this issue has not been addressed through the years? Why has spend management targeted mainly indirect spend?

IT Investment

Most of the companies have primarily invested in IT (Information Technology) for sell side and Finance. In the Sell side the goal is to manage each product sold to generate the total revenue of the company. In order to do that, a product code structure was created, so it is well known where and when the product was sold, it is possible to aggregate each product into families, sub-groups, and groups, and by business structure. So, the code structure gives the transparency needed in sales.

In Finance, the goal is to aggregate all the costs, expenses and capital, so it is possible to attend the accountant rules to generate the income statement, balance sheet and cash flow. To build the cost, it is first necessary to calculate the variable cost which is the unit ratio of each raw material, utilities and packaging times the unit cost of each one. It is clear that a product code structure is needed in the ERP (Enterprise Resource Planning) or an IT system to accomplish this calculation, so from the purchasing perspective, we are able to do spend management of direct materials once we have the code structure in place.

The issue arises with indirect spend because most ERPs or IT systems, do not “force” a code structure for indirect spend like MRO (Maintenance, Repair, Operation), Logistics (Freight), and other corporate expenditures (HR, Marketing, IT, TE). Accountants, following the rules of credit and debit, define into which cost center each expenditure can be placed to attend income statement needs, but not Purchasing needs in terms of spend aggregation.

Spend Management Software

Because of a lack of code structure for indirect spend, more than 15 companies listed by Gartner, including the biggest ones SAP (acquired Frictionless and Ariba) and IBM (acquired Emptoris), are offering software solutions for spend management. They understand Purchasing needs in terms of spend aggregation (and lack of code structure) and provide a solution for collecting, cleansing and classifying the spend data.

The principle is relatively simple: 1. they collect all spend data from different IT systems in a structure form; 2. the cleansing process detects and corrects corrupt or inaccurate data; and 3. by “reading” what was written in the purchase order and/or invoice, it classifies the spend under a code structure. The code structure can be the one defined by your company, or commonly used UNPSC developed by United Nations with help from several different companies.

The UNSPSC for a given item is composed of five two-digit identifiers, which together categorize the item into a four-level hierarchy. The four levels are: “Segment”, “Family”, “Class”, and “Commodity”. For example:

  • Segment – 40.00.00.00 = Distribution and Conditioning Systems and Equipment and Components
  • Family – 40.15.00.00 = Industrial pumps and compressors
  • Class – 40.15.15.00 = Pumps
  • Commodity – 40.15.15.21 = Rotary pumps

Having your spend under a code structure is better than nothing. However the given hierarchy does not match with how the Purchasing function is organized, so there is a need to learn and “translate” that to your organization. Also the granularity is not deep enough. For the given example, rotary pumps from different materials and dimensions were aggregated into one “commodity”. Moreover, most software companies claim that they are able to classify a minimum of 80% of the spend: The key question is, how much was classified under the lowest level? Because it is at this level where Purchasing can make a difference.

Solution

There is no doubt that the long term solution is to have a code structure for everything purchased from third parties, products and services in the ERP or IT system. Also it is a good practice to have a code structure for suppliers so you can have just one name for all the suppliers under the same organization and subsidiaries. The most advanced systems now can provide the code at the moment the requisition is typed into the system. The system containing the code structure, can “suggest” alternative codes at the moment it is written so all the processes after that contain the correct code, and so Purchasing, later on, is able to aggregate the spend accordingly.

The down-side of this approach is the cost. It is a big IT project demanding specific resources from Purchasing and IT; your company cannot stop the systems just to change the codes.

An intermediary approach is to use spend management software and the code structure developed specifically for your company. Spend management software can be “on-demand” or in the “cloud”, so at a relatively lower cost and will not “touch” your IT system. So, at short-term, you have the spend aggregation as needed, with codes you developed, and later when your company decides to improve or change the ERP or IT system, you will already have the code structure and the historical spend with the same codes.

Purchasing Strategic Planning: CPOs, Have You Done Your Homework?

Every single year all companies face the budget planning cycle. At company level, this is defined as the revenue target, the costs and expenses to run the company, and, the profitability for the following year. In a perfect world this process should be two-way street where the corporate leadership defines the targets with functions and businesses giving their input. In the end, all functions and businesses must follow the corporate guidelines.

Short Term Planning

Once the company’s targets are defined, the CPO or Vice President of Purchasing should define the Purchasing targets for the following year.

There are several Purchasing metrics available in the function that should be part of planning cycle. However I’ll mention a minimum of four targets the function head should define: Total Spend, Addressable Spend, Savings and Resources (FTE).

Total Spend can be calculated using the company’s revenue and CAPEX  (capital expenditures) plan.

Addressable Spend can be estimated based on the previous year’s sourced spend; contracts which will expire in the following year as well as major spend needs based on Revenue and CAPEX.

Savings can be defined based on improvement from the previous year’s savings in percentages (Savings/Addressable Spend), market economic cycle and relative position to market savings based on benchmarks.

Resources (FTE) can be calculated based on a budget defined by the corporation and previous year’s capacity (Spend/FTE) for each commodity.

With these four targets, as VP of Purchasing or CPO, you are covering Efficiency (Addressable Spend / FTE) showing how much you can handle with existing resources and Effectiveness (Savings/Addressable Spend) showing the quality of your sourcing projects.

Based on these targets, each Commodity Director can start defining the projects to be sourced next year, using the same metrics, and, the Sourcing Managers (buyers) can define their personal goals using the same metrics.

Long Term Planning

Strategic Planning is more elaborate and time consuming. The CPO or VP of Purchasing should lead the Strategic Planning exercise every three years covering the next five years. The objective is to define: Vision and Mission for the Purchasing function, as well as the Objectives and Goals for the next five years.

There are several methodologies to define this roadmap; however my preference is get grounded in facts; externally and internally. Let me elaborate about it.

Externally: Generate data from Global Economy Trends, Your Industry Trend and External Purchasing Trends.

Internally: Get data from Your Company (Business) Strategy and Your Purchasing Function.

Once you get all the information and data, through several sessions with the purchasing leadership, cluster and affinitize the ideas and trends into five to seven themes related to the Purchasing function. For each theme, define the strategic objective. Now you have enough material to define the Vision and Mission for Purchasing.

For each strategic objective, you need to define the goals for the next five years. Define as many goals as you think appropriate, then prioritize them by using value and impact to the company, also defining the completion date. It is recommended that for each strategic objective, the CPO defines a person from leadership as “owner” of the objective.

Once you complete the Long Term Planning, it is much easier to do the Short Term Planning because now you understand the “roadmap” and each year you refine the goals aligned with the business strategy.

As strategic planning is complex and time consuming, it can be worthwhile to have an outside consultant to help with the development of this process, at least for the first time. The consultant is unbiased and has an outside perspective helping to challenge the goals.

Now that you have done your homework, I wish you Happy Holidays and a very efficient and effective 2013.

Risk Management: A Comprehensive View for Purchasing

According to Warren Buffet: “Risk comes from not knowing what you are doing”.

A good example of knowing what they are doing comes from the Insurance industry. They measure and track all kinds of risks they may have before defining a premium for an insurance policy.

We have good references from American National Standard for Security (ASIS SPC.1 2009) in how a company may be prepared for organization resilience for security, preparedness, and continuity management. This helps companies to define the overall framework for ERM – Enterprise Risk Management.

Just as a reference, several consultant companies have reported the same issue regarding risk management in purchasing:

  • AT Kearney 2011 report Procurement Leaders list “Manage Risk Systematically” as one of top priorities.
  • The Hackett Group also reported in The CPO Agenda 2012 as top priority “Reduce Supply Risk”.
  • KPMG reported The Power of Procurement 2012 – “Prioritizing supply chain risk: Given the events of the past five years – financial crisis, natural disasters and massive supplier failures, to name just a few – the research demonstrates a worrying lack of leadership in the area of supplier risk.”
  • Kairos Commodities and Valcon and 12 Purchasing institutes in Europe reported; “45% of companies have no commodity risk strategy in purchasing on how to address their total spend.”

Purchasing as part of any enterprise should define their framework, as part of ERM, in terms of types of risk they face, risk appetite (risk level), tools to measure the risk and calculate the impact in the company and governance to make sure the processes are followed, the risks are tracked and mitigation plans are in place and implemented.

We can list at least four risk types: Supplier Risk, Product / Service Risk, Business Risk, Commodity Risk, and in each one you will have different risk drivers.

Supplier Risk related to financial stress, geographic location, code of conduct, border crossing, trade compliance, product stewardship, quality and delivery.

Product Risk related to supply / demand, number of qualified suppliers, specification, volume under contract, technical options, lead time and supplier back integration.

Business Risk related to number of approved suppliers (sole sourced), number of plants and their location, and impact on revenue in case of disruption.

Commodity Risk related to supply / demand balance, suppliers, market forces, cost drivers, resource planning and sourcing strategy.

The key question from Warren Buffet: Do you know what are you doing?

The key question for purchasing professionals: Do you measure and track your risks?

Aberdeen – Strategic Sourcing 2.0 – June 2012

Excellent article showing the key steps for a Strategic Sourcing and main concerns from CPO’s. It describes eSourcing, Spend Analysis, Project Management, Contract Management and capabilities from SAP on demand.

I agree with the main conclusion that companies with established Strategic Sourcing process in place present higher savings. PM2 Consulting can offer Strategic Sourcing process and tools.