CHEMICALS PRICE FORECAST
Most manufacturing industries consume chemicals or plastics as raw materials or auxiliary materials in their production plants. To simplify this discussion, I will refer to chemicals and plastics together as chemicals.
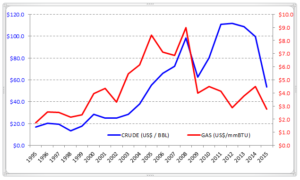
Since 2012, the peak year for oil prices, Crude Oil prices have fallen, and all chemicals users have enjoyed lower prices for Crude Oil derivatives. However, I believe this scenario will change in 2016 and 2017. In parallel fashion, Natural Gas prices have also fallen during same period, as shown in the graph below. This is important to note as both feedstocks drive price movements for chemicals.
Background
Although several chemicals can be produced from Crude Oil or Natural Gas, most chemicals pricing follows Crude Oil prices. For example, Ethylene can be produced from Crude Oil or Natural Gas but follows Crude Oil prices, so producers of Ethylene using Natural Gas (at a lower price) enjoy a higher margin when Crude prices are high.
There are competing theories about the reasons for the Crude Oil price decline. Some conspiracy theorists believe the Organization of Petroleum Exporting Countries (OPEC) wants to financially restrict Iran and ISIS, which are both financed by oil exports. Others believe that OPEC wants to decrease the global oil inventory so the price will increase easily. My own view is that global oil prices declined in order to delay Shale Gas (mainly in the U.S.) investments and further production. Note: Shale Gas is Natural Gas in a different formation, which is cheaper than Crude.
Future
Any financial analyst of commodities or chemical specialist or, in fact, any person at large may try to predict the future. It is only after the fact, however, that we can realize who was right! So, I will give my view.
My first prediction concerns the chemicals industry in the U.S. This industry reported US$1,041 billion in revenue in 2014, and I believe it will reach US$1,400 billion in 2020, through a combination of price and volume increases.
My second prediction is related to Crude Oil. My view is that the Crude Oil price will reach an average of US$50/BBL in 2016 and US$60/BBL in 2017. As we all know, supply-demand balance defines the price, and in May, Bloomberg reported that OPEC ministers were “happy with the direction of the oil market” to “eradicate surplus production.” A second indication is the tremendous financial impact on the oil exporters. A recent Deloitte article provides a clear view of the impact on the budgets of oil exporters, showing they need a certain level of oil price in order to balance their internal budgets. Russia, for example, is heavily dependent on its oil revenues, with Oil and Gas accounting for 70 per cent of total export revenues. The country loses about $2 billion in revenue for every dollar fall in the oil price. The only oil exporter with high levels of monetary reserve to support this pricing environment is Saudi Arabia, and all others are struggling.
Assuming the oil prices as shown below, with Natural Gas around US$2.70/mmBTU, we may predict the following impact on Ethylene and Propylene.
| 2016 | 2017 | |
| Crude Oil (US$/BBL) | $50 | $60 |
| Ethylene (US$ cts/lb) | $29 to $31 | $33 to $37 |
| Propylene (US$ cts/lb) | $34 to $39 | $39 to $45 |
The above predictions are based on statistical correlation analysis over the last 10 years.
Let us be very clear that the prices of Ethylene and Propylene are driven by the feedstock but also by the supply-demand balance of each one, as well as other derivatives. For example, Ethylene pricing depends on demand for middle-distillate products like gasoline, diesel, and heating oil. Additionally, propane pricing represents a ceiling price for Ethane. As result of all these drivers, Ethylene and Propylene prices have presented a delta (Propylene less Ethylene) between -$5 in 2000 to +$20 in 2011. Therefore, the prices may fluctuate much more than shown here.
There are several different chemicals, and the cost of each is driven by its feedstock as well as the supply-demand balance in that region. With that understanding, one approach would be to look at long-term historical data plus the delta range between the chemical and their feedstock and then relate these to the historical Crude Oil price. This would give an indication of how much your prices may increase.
For now, I propose you check these prices at the end of 2017 to see if I was right. If not, sorry; I just gave my view.
Taking Purchasing to the next level,
Paulo Moretti

